
| Tech Tip # 1 Noise Measurement |
One of the most important attributes of a quality characterization of an audio device is its noise or signal-to-noise ratio. This can be expressed many different ways; as absolute noise, as a ratio, as weighted, unweighted or band-limited. Additionally, the characteristics of the detector used to make the measurement will affect the result. With such a wide variance of factors involved, it can be difficult to make valid performance comparisons between devices.
There are many possible sources of noise in audio circuits. Here we are limiting our discussion to the intrinsic noise produced internally in a particular audio device. All circuits produce some noise and generally this noise is reasonably constant across the full audio spectrum. Occasionally, a malfunction or poor design may cause the introduction of interfering noise in a particular part of the spectrum. A common example of this might be power supply induced main hum or magnetically induced main hum, which will typically be strongest at the fundamental frequency of the local mains or, with poor power supply filtering, at the second harmonic of the mains.
Sometimes the dominant source of noise may be an external influence like crosstalk from another circuit. Or it might be interference from an RF source (RFI) that could sound like a radio station or a buzzing sound (the 60Hz sync signal from a television transmission).
Noise
Weighting
Frequently, noise is measured using frequency weighting. This
is based on the theory that the sensitivity of the ear to high and low
frequencies is reduced at lower levels. Since noise is usually at a lower
level, it makes sense to approximate the subjective annoyance of noise
by using such weighting when making noise measurements. Several standards
organizations define specific filter shapes to achieve frequency weighting.
In the US, audio measurements frequently are made using "A"
weighting. Telecom and communications equipment measurements are made
using "C-Message" weighting. In Europe, CCIR-468 is a common
weighting. Each of these filter shapes, while different, has a significant
roll off at high and low frequencies and nominal unity gain at a mid-frequency.
And all represent a collective opinion or approximation of the frequency
response of human perception at low audible levels.
The CCIR-468 filter shape has a substantial peak of approximately 12 dB
at about 12kHz relative to its unity gain at 1kHz. Noise meters need special
designs to allow for this peak so they won't "clip" with noise
spectra heavy in high frequency content.
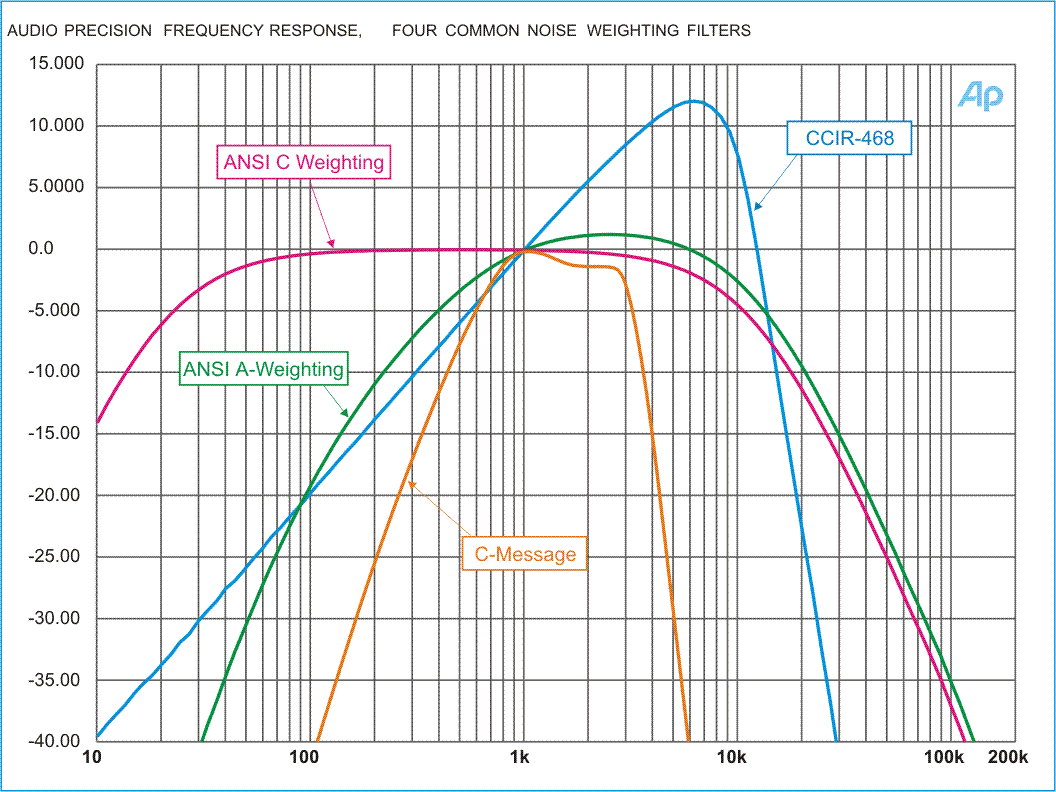
Examples of Noise Weighting Filter shapes
Noise
Meter Detectors
The detector that follows the weighting filter can be one of three
popular characteristics. These days, an "rms" (root-mean-square)
characteristic is most common. Early level meters were "average responding,
rms calibrated". Their detection characteristics measured the ac
signal level in terms of its average value but expressed the result with
the assumption that the signal was a steady state sine wave. A third detector
characteristic is "peak" responding. The CCIR-468 standard defines
the characteristics of this peak detector. It specifies the time it takes
the detector to acquire the peak value of a signal and the time it will
take the meter to decay to zero after the signal disappears. This will
determine how the meter will respond to a time varying signal, such as
noise. It will be less responsive to very short peaks but will dwell a
short time after the signal level decays. Again, this time characteristic
was chosen to approximate human perception of time varying noise.
Weighted
versus Band-Limited
We have concentrated on weighting characteristics---the filter
shape that focuses on mid-band signals. Noise can also be measured with
no weighting, sometimes called "flat weighting". This uses a
level meter with equal response to the complete spectrum. It does not
correlate well to perceptual annoyance but is useful in a development
environment to characterize noise across the band.
Although this type of measurement is unweighted, it is band-limited. It
may be naturally band-limited by virtue of the inherent frequency response
to the level meter. But, with a wide variance of meter responses available,
this can produce unpredictable results. It is preferable to intentionally
set the band limit to a specific range. Common ranges would include: 20
Hz to 20 kHz in the US or 22.4 Hz to 22.4 kHz in Europe. Other ranges
include 10 Hz to 100 kHz and 50 Hz to 15 kHz in the broadcast industry.
The only one of these actually defined in a standard is the 22.4 Hz to
22.4 kHz which is part of the CCIR-468 standard referred to above. The
other ranges are simply common practice.
For a noise measurement to be useful and comparative, it must be accompanied
by the conditions of measurement: the weighting or band limiting used
and what detector was used.

Examples of Band-Limiting Filters
Absolute
or Ratio
It was mentioned earlier that noise measurements can be absolute
or a ratio. An absolute noise measurement is simply a statement of the
noise level at the output of the device with no signal presented to the
input. Additionally, the input should be "terminated" with the
same impedance that a typical signal source would present to the device
in order to characterize the device under its normal operating conditions.
When absolute noise measurements are made, any variable gain of the device
must be set to a defined value. This may be full gain or some typical
operating setting. Again, this setting should be specified along with
the noise measurement result as it has a very direct affect on its value.
When noise is expressed as "signal-to-noise ratio", it is an
expression of the absolute noise compared to an agreed reference level.
This reference level may be defined in a standard or may just be common
practice. In some cases, it is the signal level that produces 1% THD+N,
or 3% THD+N. In some cases, it is the maximum level before clipping of
"full scale" level. In professional audio applications, it may
be the level that produces "0 VU" on the level meter that is
part of the device being measured. In power amplifiers, it may be the
level that produces the rated power output. Since it directly affects
the stated SNR value, this reference should be stated with the measurement
result.
Add
the Frequency Dimension
All of the discussion above has related to the measurement and
statement of a single noise value. This is, of course, the most common
approach and makes comparisons easier and production line quality determination
quick. For diagnosis and analysis, a single number gives little insight
into the causes or sources of noise. Is the noise actually crosstalk,
is it hum, hiss, or some other identifiable signal? To get this information,
use spectrum analysis. This is simply a measurement of noise in several
specific narrow frequency bands across the total range of interest. It
produces a noise versus frequency graph. A well-behaved device will have
a somewhat flat noise spectrum. Specific sources of noise will clearly
show up in such a graph. Spikes at 60 Hz will indicate magnetic coupling
of circuits from the AC mains source. Spikes at 120 Hz will indicate ripple
from a power supply with inadequate filtering or rectifier commutation
transients. A steep roll up at the high-end will indicate hiss, perhaps
caused by an over-sampling converter. This spectrum analysis graph can
be very useful to track down the source of noise.